pie 相关

颜色的自定义问题

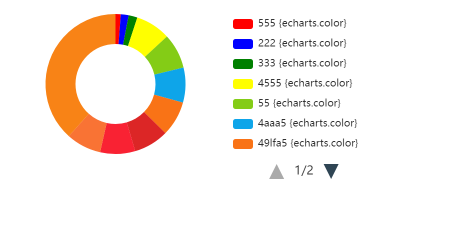
首先, 对于颜色的自定义问题, 在最新的echarts文档中, 并没有明确的给出, 不过经过尝试发现, 自定义的方式有很多种。

下面给出示例代码(vue模板格式), 请自行选择合适自己的自定义颜色方案(可根据注释的介绍自行组合):

1
2
3
4
5
6
7
8
9
10
11
12
13
14
15
16
17
18
19
20
21
22
23
24
25
26
27
28
29
30
31
32
33
34
35
36
37
38
39
40
41
42
43
44
45
46
47
48
49
50
51
52
53
54
55
56
57
58
59
60
61
62
63
64
65
66
67
68
69
70
71
72
73
74
75
76
77
78
79
80
81
82
83
84
85
86
87
88
89
90
91
92
93
94
95
96
97
98
99
100
101
102
103
104
105
106
107
108
109
110
111
112
113
114
115
116
117
118
119
120
121
122
123
124
125
126
127
128
129
130
131
132
133
134
135
136
137
138
139
140
141
142
143
144
145
146
147
148
<template>
<div class="flex flex-initial h-full w-full justify-center">
<div id="main"
class="w-[450px] h-[200px]">
</div>
<div class=""></div>
</div>

</template>


<script setup lang="ts">
import * as echarts from 'echarts';
import { onMounted } from 'vue';

onMounted(() => {
// 基于准备好的dom,初始化echarts实例
var myChart = echarts.init(document.getElementById('main') as HTMLElement);

// <设置每个扇形颜色的第三种方式> => {这样写后, 在series中使用data来进行值的设置(可以直接设置上颜色); 若是使用encode的话, 必须结合后面的第一第二种方法才能设置每个扇形的颜色 -> 即通过map遍历获得颜色数组, 像第一种第二种那样设置}
// const data = [
// { name: '111', value: 12, itemStyle: { normal: { color: 'red' } } },
// { name: '222', value: 18, itemStyle: { normal: { color: 'blue' } } },
// { name: '333', value: 18, itemStyle: { normal: { color: '#84cc16' } } },
// { name: '444', value: 18, itemStyle: { normal: { color: 'yellow' } } },
// ]
const data = [
['555', 12, 'red'],
['222', 18, 'blue'],
['333', 20, 'green'],
['4555', 80, 'yellow'],
['55', 80, '#84cc16'],
['4aaa5', 80, '#0ea5e9'],
['49lfa5', 80, '#f97316'],
['adfasdklj', 80, '#dc2626'],
['49l5', 80, '#f92233'],
['49a5', 80, '#f97334'],
['lfa5', 380, '#f88316'],
]

const aa = [12, 13, 14]

// 绘制图表
myChart.setOption({
dataset: [
{
source: data
}
],
title: [
// {
// text: '时间分析',
// left: 'center'
// },
// {
// subtext: 'alignTo: "edge"',
// left: '50%',
// top: '90%',
// textAlign: 'center'
// }
],
// 选择器(可以选择哪个不显示)
legend: {
type: "scroll",
selectedMode: true,
orient: "vertical",
left: "50%",
top: '15%',
itemWidth: 20,
itemHeight: 10,
formatter: '{name} {echarts.color} ', // 百分比变量要自己算一遍
// tooltip:{
// show: true
// }
textStyle: {
// color: echarts.color,
fontSize: 10,
},
// type: 'legendScroll'

},

// tooltip: {
// formatter: '{b}: {d}%',
// },

// <设置每个扇形颜色的第二种方式> (仅此一步即可, 本质是赋值一个数组)
// color: ['red','blue','green','yellow'],

series: [
{
// name: "555",
type: 'pie',
radius: ['40%', '70%'],
center: ['25%', '50%'],
avoidLabelOverlap: false,
label: {
show: false,
position: 'center',
// alignTo: 'edge',
// margin: 0,
formatter: '{b}: \n {d}%',
},
emphasis: {
label: {
show: true,
fontSize: 8,
// fontWeight: 'bold'
}
},
labelLine: {
show: false
},
encode: {
itemName: 0,
value: 1,
},
// <设置每个扇形颜色的第一种方式> (本质是通过 params.dataIndex索引项, 来依次索引所需要的颜色值 -> 即 此处color的赋值 必须是不同的单个颜色值 , 通过params参数来自定义是echarts的常用方式)
itemStyle: {
normal: {
// color: function(params:any){
// // var colorList = ['red','blue','green','yellow']
// var colorList = data.map((item:any)=>{
// return item.itemStyle.normal.color
// })
// return colorList[params.dataIndex]
// }

color: (params: any) => data[params.dataIndex][2]

}
},
// data: data,
left: 0,
right: 0,
top: 0,
bottom: 0
}
]
});
})

</script>


<style lang="scss" scoped>

</style>

此示例代码效果图如下:

数据集更新后, 让echarts图例也跟着更新

根据官网介绍的异步数据刷新方案可知, vue中的刷新方式如下:

1
2
3
4
5
6
7
8
9
10
11
12
13
14
15
16
17
18
19
20
21
22
23
24
25
26
27
28
29
30
// 这个不要多说, 需要在加载之后绘制echarts
onMounted(() => {

// 基于准备好的dom,初始化echarts实例
var myChart = echarts.init(document.getElementById('main') as HTMLElement, undefined, { renderer: 'svg'});

watchEffect(() => {
//通过对响应式数据处理来获得我们需要的数据集data
......
......
const data:Array<Array<string>> = []
......
......
myChart.setOption({
// 这里写图表的具体配置
// 如配置data到数据集中
dataset: [
{
source: data
}
],
......
......
......
......
})

})

})